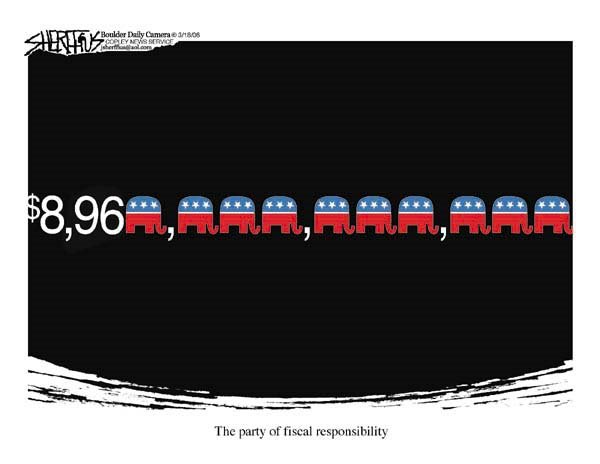
Fiscal Responsibility

The estimated population of the United States is 298,986,071, so each citizen's share of this debt is $28,074.39.
The National Debt has continued to increase an average of $2.44 billion per day since September 30, 2005!
From the website Wampum (read the whole article), a summation of growth in the national debt since 1960:
Ranking the twelve individual four-year Presidential terms from Kennedy through President Bush's second term by the percentage increase in the national debt (from most debt to least), we get the following:
Reagan I 89.1%The worst four spots (and seven of the worst eight) are held by Republican Presidents, while the four best spots are held by Democrats. Only one Democrat (Carter) is among the worst eight terms. (Please note that the George W. Bush II term could move to a worse spot in the rankings.)
G.H.W. Bush 54.4%
Ford 53%
Reagan II 46.8%
Carter 43.1%
G.W. Bush I 36.6%
G.W. Bush II 32.4%
Nixon 27.7%
Clinton I 22.7%
Johnson 15.0%
Kennedy 8.45%
Clinton II 7.3%
While all other administrations are ranked according to actual performance, the second Bush term is ranked by his administration's own budget estimates. Those estimates include nothing for the Iraq or Afghanistan wars, assume no fix of the alternative minimum tax, assume discretionary budget cuts that the Senate has already rejected, as well as other questionable assumptions.
All told, our analysis shows that 80% of the national debt has been incurred in years in which Republican Presidents submitted the budget while about 20% happened under budgets submitted by Democrats.
 So, if you want balanced budgest and fiscal responsibility, VOTE DEMOCRAT!
posted by Luba @ 10:49 AM
![]()
![]()


0 Comments:
Post a Comment
<< Home